Beginning Datalogging with the
LEGO MINDSTORMS NXT --- Brian Davis
Preamble – Why I Bother.
On several occasions, people have
asked me to help them with datalogging, so I thought I’d put this little guide
together and put it on-line for the community. I’m choosing here to use NXT-G,
because it’s the environment that most people have access to for the LEGO NXT
microcontroller (and one I have some experience with), but the ideas here are
much more general. If you use a different language (RobotC, pbLua, NXC, etc.)
or even a different platform (BASIC microstamp, RCX, etc.) many of the ideas
are the same, just the implementation changes. And some of these languages
offer advantages over NXT-G in speed or data manipulation as well, so please
use whatever you choose
On a more personal note, I’m doing
this because it’s fun to explore the world around me, and I’ve found
datalogging with the LEGO NXT amazingly easy (easy enough for a grade school
student) yet powerful (enough that I’ve used it for high-altitude research on
the edge of space). With a handful of relatively cheap sensors and the NXT
brick, there are an almost unlimited number of things I can explore and learn
– limited primarily by my imagination, not my pocketbook, and I can
re-use the same equipment again & again, and know that others can repeat
these investigations, without access to even a high-school science lab… just
what they can get at a toy store and an on-line retailer or two.
What is Datalogging
The basic idea of datalogging is
to run an experiment, but have a computer do the tedious data recording for
you. For instance, if you wanted to know how the temperature changes during the
course of an entire day, you could sit by a thermometer, carefully recording
the temperature every five minutes on a sheet of paper, and then graph the
results later… but it would be a huge amount of work. And in some cases you
might want to learn about the conditions somewhere dangerous or inaccessible
(does the light really go out in the refrigerator when you close the door?), or
figure out what’s happening in a process that’s too fast to manually record
(how fast does an incandescent light bulb turn on?). In all these cases you
could use a microcontroller like the NXT to automate the process. In fact there
are a number of commercial dataloggers available, for natural or industrial
environments, but they tend to be either very specific (recording only a single
specific sensor or two) or rather expensive (several hundred to several
thousands of dollars). With the NXT, it’s flexible, relatively inexpensive, and
very common. There are a large number of simple sensors commercially available,
and many books and websites can show you how to make your own custom sensors
that are fairly easy to interface.
Some examples in the “real world”
are monitoring the temperature & humidity of a museum showcase, or the
water level in a river during a rainstorm. Dataloggers have also been used to
monitor the accelerations experienced on roller coasters (an instrumented “test
dummy” is sent through the ride before a human generally is), the eruption
period of geysers in Yellowstone National Park (by recording the temperature of
the runoff from the geyser), or the accelerations and gas consumption of a
truck during its cross-country drive. Perhaps one of the best-known uses of
dataloggers is an airplane’s “black box” recorder. This is essentially a
datalogger for all the critical systems of the plane: the positions of the
control surfaces, airspeed, accelerations, and often many other sensors. All
this can be used to try to reconstruct what happened during a flight (a
variation on this was a datalogging device present on the Space Shuttle
Columbia, that provided a huge number of measurements about the disaster when
it was found, largely intact, on the ground).
Beginning Datalogging
A simple example of datalogging
would be studying the light level in a room over a period of time. For
instance, sometimes when you first turn on a florescent light it starts out
slightly dim, and then gradually brightens over time. You can see this, but to
determine how long it takes to reach “full brightness”, or how much it actually
increases in brightness during the first few minutes is tougher to put a number
on – and an easy, common thing to practice datalogging
If you were to do this “by hand”,
you could just write down the measurement reported by the light sensor every
second (or faster, if you could), and after a few minutes or so stop and graph
the resulting data. The NXT can do the same thing, but instead it writes the
information into a file in its memory. So we want a program that just Loops
constantly (or for as long as we want it), reading the value of the light
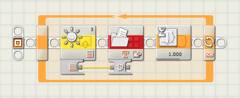
sensor and wiring that result into a File Access block. Here’s a program that
reads the ambient light value from a light sensor once every second, and writes
that result into a file named “DLog.txt”:
 Fig
1-1: a minimal datalogging program. The Light Sensor block is configured to not
generate light (uncheck the “Function” checkbox) and the File Access block is
set to Write a number (not text) with a file name of “DLog”
Fig
1-1: a minimal datalogging program. The Light Sensor block is configured to not
generate light (uncheck the “Function” checkbox) and the File Access block is
set to Write a number (not text) with a file name of “DLog”
{Link to Logger1.rbt}
Run this program in a dark room,
turning on the lights after 10 seconds or so, with the light sensor pointed
towards the lights. Let it run for about a minute, keeping the sensor
stationary, stopping the program by hitting the “Cancel” button, (as the Loop
is set to run forever, that’s the only way to have this program halt). After
running this program, connect the NXT to the computer and look at the memory of
the brick using NXT-G. If you select “other” from the bar chart on the left, a
list of files will pop up, including the newly-created “DLog.txt”. By selecting
this file from the list and clicking the “upload” button, NXT-G will transfer a
copy of this file to your computer. If you open this file in a word-processing
program, you’ll see a series of numbers, and if you open them in a spreadsheet
program, you can graph these numbers and see exactly what the sensor reported
each time it was recorded.
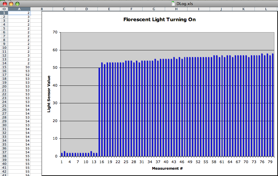 Fig
1-2: the series of numbers written to the “DLog” file, and a simple bar graph
of the data. Each bar represents the light sensor reading for that second of
the program run
Fig
1-2: the series of numbers written to the “DLog” file, and a simple bar graph
of the data. Each bar represents the light sensor reading for that second of
the program run
That’s the idea, but there is a
lot of room for improvement. First it would be nice if the NXT also told us
when it took the measurement, so we don’t have to figure it out later and
remember exactly what the interval was that we programmed into it. We could do
that by reading a Timer, and combining that reading with the light sensor
reading (separated by a comma) on each line. To do that we need to convert both
numbers to pieces of text, and combine them with a comma between them before
writing them to the file, but that’s not too difficult:
 Fig
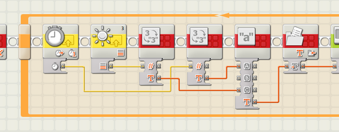
1-3: the same program, with a Timer block added, and the output of both blocks
converted to text (in the first two red blocks) and then combined into one text
string (in the third red block; the middle “b” field has a single comma entered
into it in the configuration pane), and the result wired into the ‘text’ plug
of the File Access block. Make sure the File Access block is now set to ‘Text’.
Fig
1-3: the same program, with a Timer block added, and the output of both blocks
converted to text (in the first two red blocks) and then combined into one text
string (in the third red block; the middle “b” field has a single comma entered
into it in the configuration pane), and the result wired into the ‘text’ plug
of the File Access block. Make sure the File Access block is now set to ‘Text’.
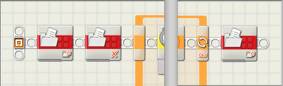
And since we have all that
information streaming into the NXTs memory, we might as well display it on the
LCD so we know the program is running, and what it is “seeing”:
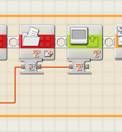
Fig 1-4: the same text that is sent to the File Access block
is wired into a Display block (set to display text)
If we ran the original program a
second time, we’d find that the new data just gets piled behind the old data.
So for the 2nd version, put in two blocks at the start to close and delete any
file with the name we’re going to be using (starting with a clean slate), and
just to keep things neat a third block to close that file when the program ends
(the NXT should do this for us when the program ends, but it’s a good habit):
 Fig
1-5: some File Access blocks, all with the “DLog” filename, to close, delete,
and finally close the finished file.
Fig
1-5: some File Access blocks, all with the “DLog” filename, to close, delete,
and finally close the finished file.
And since the NXT is doing all the
work for us, we might as well measure the light level much more frequently, so
we’ll change the Wait block to only pause for 20 milliseconds, or 0.02 seconds
between measurements (that’s a lot more
measurements, but hey, the computer is doing all the work), and while we’re at
it change the Loop so it exits when we hit the right arrow button (instead of
Loop forever). The resulting program looks like this:
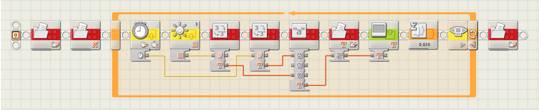
Fig 1-6: an entire datalogging program, stopped by the right
arrow key
{Link to Logger2.rbt}
Run this program again in a dark
room (preferably one with a “cold” florescent light that hasn’t warmed up
recently), then connect to the NXT, select the file “DLog.txt”, and uploaded it
to the computer. Now open the DLog.txt file on the computer with a spreadsheet
( I use Excel, but almost anything should work). Many spreadsheets will
automatically import this sort of file as “comma separated values”, but if not
this can be forced (changing the extension to “.cvs” will often work, or you
can specifically configure how the data is imported in a series of dialog boxes
in Excel, for instance. The result is two columns of data, the first being the
time reading (usually called a “timestamp”), and the second all the
corresponding light sensor readings. Graphing these as an X-Y graph (using, for
instance, the graph wizard in Excel), we’ve got a detailed record of “what the
light sensor saw”:
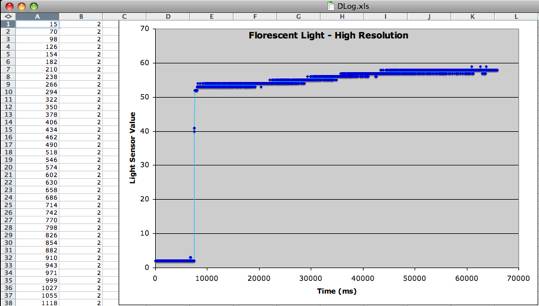
Fig 1-7: A high-resolution record
of the light turning on
That looks great. For instance, I
can now clearly see the lights getting slowly brighter, and see just how fast
the lights turn on. But there are still a few problems. First if I look at the
difference between the timestamps, the seem to be about 28 milliseconds, not 20
like we specified (and on rare occasions, there seem to be even longer pauses).
The reason for that is simple: while the Wait block is waiting for 20 ms, there
are other things going on in the Loop as well (such as sensor reading,
formatting text, file writing), so one iteration of the Loop actually takes
longer than just the time delay set on a simple Wait block. What we could do is
replace the fixed Wait block with an inner Loop that only finishes when a 2nd
timer exceeds the limit we set (say, again, 20 ms), and then right after that
resets the 2nd timer to begin that “countdown” for when to do the next reading:
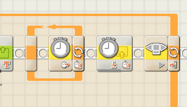
Fig 1-8: a Loop until timer #2 is greater than 0.02 seconds,
followed by a block to reset timer #2
{Link to Logger3.rbt}
That works much better (the normal
interval between records is now about 21 milliseconds, close enough). But
looking at the data, on rare occasions the timing between readings is still
larger that expected (in some cases, particularly if the program records a lot
of data, a lot larger). These sort of unpredictable timing issues really make it
important to timestamp the data in most situations. These odd “pauses”, by the
way, are because the NXT doesn’t immediately write all the information to
memory when you ask it to – instead, it usually waits until it has
“enough” text ready to write, and does it all at once. The occasional very long
pauses are due to the NXT having to move the entire file (copy it into a new
portion of memory) because it ran out of room where the old file was growing.
There are ways around at least the 2nd of these problems, but they are a little
advanced – I only mention it so that people understand what’s happening,
even if you’re not worried about it most of the time.
Other Basic Points & Tidbits
There are a few other things that
we really have to think about with datalogging on the NXT. The first is how
long you want to log – and keeping the NXT awake and alive that long. The
NXT is usually set up to automatically turn itself off if a button isn’t pushed
after a certain amount of time. If the NXT thinks it’s should shut itself off
after 10 minutes, and you try to run a program unattended for an hour, you’ll
return to find the NXT turned off and only about 10 minutes of data in the
file. There are two solutions to this. First, you can navigate the NXT’s
on-screen menu systems to set the sleep time to “never”. That will work just
find, but if you ever forget to turn the NXT off when you’re done with it,
you’ll find it has remained on until the batteries have been completely
drained. A second solution is the Keep Alive block. This is a block that resets
the “countdown timer” on the NXT, functioning the same way as a person pushing
the button – a way to tell the NXT to remain awake (and running our
datalogging program). All we need to do is make sure that the program occasionally
executes a Keep Alive block as long as it is running; for instance, have one at
the end of the main Loop:
 Fig
1-9: The Keep Alive block inside the main Loop, so it is executed each time
through
Fig
1-9: The Keep Alive block inside the main Loop, so it is executed each time
through
This solution has another
advantage as well. As long as the program is running, it will keep the NXT
“awake”… but once the program ends (perhaps, after your program has run for the
desired amount of time), the NXT is free to “time out” and shut itself off,
conserving whatever power source it was running on. This would be very handy if
you were running on battery power, and don’t want to just wear out batteries
repeatedly on long-term projects.
This brings up the related
problems of power-sources: conserving batteries is good, but for really
long-term projects, normal batteries might not be enough (or, you might be
tired of recharging or buying new ones constantly). If you have the LEGO Li-ion
battery pack for the NXT and you are working indoors, you can plug the NXT into
a wall outlet, running it from the house current and not from the batteries.
This way you can continually acquire data for perhaps days or weeks at a time
– without spending a fortune in replacing batteries*. Even if you don’t
use the Li-ion battery pack, normal fresh batteries can run the NXT for a very
very long time, as long as it is not driving motors continuously. The more
“mAhr” (milliamp-hours) a battery packs, generally the longer it will last;
normally longer than 24 hours or more. In the only case I’ve fully documented,
it took more than 50 hours of continuous datalogging to wear out one set of
Energizer Lithium E2 AA’s (these are also very light weight, and have amazing
low-temperature performance… they will continue driving the NXT at temperatures
far below freezing, for instance).
Another improvement that we could
make is to have the code look a little better, and maybe be more reusable as
well. Now that we have a program that can log a sensor value, we could probably
just make a My Block that would function as a “Log Value” block, taking as an
input something to write into the file, and adding the timestamp for us,
perhaps even handling the timed wait. Turning all this into a My Block not only
makes the program easier to understand, but it means the next time (in this
program, or in some other) that we need to log some data, we have a known,
tested, debugged way of doing it, and don’t have to “reinvent the wheel” each
and every time. Here’s a very simple example called “EasyDL”; it uses a My
Block named “Timestamp” to record a number that is wired into it to a file,
taking care of all the formatting and details for you. It’s not as accurate, or
as flexible, as the first program we developed, but it shows an alternate way
of doing it, and one that makes it extremely easy to put together a
spur-of-the-moment datalogging program:
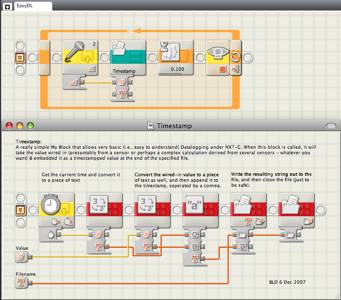 Fig
1-10: EasyDL, a very simple program that will log the sound sensor value using
a My Block
Fig
1-10: EasyDL, a very simple program that will log the sound sensor value using
a My Block
Another thing this program
demonstrates is that the file name to be used can be wired in as well, so that
it could be changed from run to run, for instance… allowing one program to
create different files like “Logfile1”, “Logfile2”, etc., instead of just
always overwriting the one files). All that’s needed is a simple way for the
user to adjust the file name (perhaps by adding a user-specified number that’s
entered using the left and right arrow keys on the front of the NXT), and
during one trip away from the computer (say, a visit to an amusement park) the
user could take multiple files throughout the day, without having to download
each and every one before taking a new one.
Finally, while this is all well
and good, there are lots of other things to log than just the readings of a
single light sensor. What if we wanted to log a sound sensor (say, to monitor
noise levels in a school hallway)? Well, just replace the light sensor block
with the sound sensor one, or whatever else we want to log: maybe a custom
sensor, or a number calculated some other way. Of course we can also log more
than one piece of data at each timestamp – the same way a comma was used
to separate the time from the sensor in the file, another sensor could be added
to the same line, just separated by another comma. That way, when we import the
file into the spreadsheet program, it ends up with three (or more) columns, one
for each piece of data. There’s a lot of flexibility to take advantage of even
with this very simple program. And the beauty of this method is that not only
are you learning about the results of the datalogging, but by doing it yourself
you end up understanding how datalogging works… as well as when it doesn’t, and
how you can change it to suit exactly what you want it to do.
*Note: some users have reported
that the LEGO Li-ion battery packs have failed after having been plugged in for
weeks at a time (but other users have had them function even after such use).
In general, it might be a good idea not to just leave it plugged in
continuously for months at a time, but I’ve personally had no problems… yet.
You have been warned J.
Parting Thoughts
Why use the NXT? Seriously, there
are some amazing datalogger from some very good companies that will do all this
and much more. Commercial units can usually log much faster than the NXT, often
much longer, and usually can store many more datapoints before filling their
memories. In addition most commercial packages come with analysis software and
are often smaller. Some of them are even cheaper than the NXT, and I’ve used
and could recommend several from different companies. So why bother with the
NXT?
First, the NXT gives a flexibility
that’s hard to match in such an inexpensive package. Not only can it interface
with a fairly wide variety of sensors and record more than one input channel,
but almost unheard of is the degree of control you have over what and how it is
logging things. Any pattern of logging you want you can program – you are
in no way limited to the way the manufacturer “thinks” it will be used. For
“brainless” datalogging (taking a series readings at pre-set intervals) almost
any off-the-shelf datalogger can be used. But with the NXT, a computer under
your control, you can do “smart” datalogging. Log only when values are changing
rapidly, or only when certain sensor are in certain ranges. Even control motors
or lights or other outputs, depending on what the situation is. These are
abilities almost no commercial dataloggers can match, and certainly nothing in
the price range of the NXT.
Second, from the standpoint of
education the NXT gives you a tool that is almost completely “transparent” to
the student. Because the student has to program it, they need to understand
what exactly the sensors are doing. Should we measure the instantaneous sensor
reading, or the average? Or perhaps we want to record the maximum and minimum
values and log those? Once we have the data, what does it mean? How do we
convert the sensor readings to “real units” like accelerations in meters per
second squared, or light levels compared to some known standard? What is the
resolution or precision of the data, and how is that different from the
accuracy? All these are critical questions to understand… and often they get
glossed over because either the student is never forced to face them, or worse
has no way to manipulate them (is the commercial datalogger recording the
average readings, or the instant-by-instant readings? Or something else? Often,
the user doesn’t even know). With the NXT you have a tool that is “open” to the
student (and teacher!) in a way a commercial unit isn’t. The NXT isn’t just a
way to produce some data for analysis – it’s a way to understand how that
data is obtained. And in an educational setting that is far more important than
“just the numbers”.